

SRM Power Smoothing
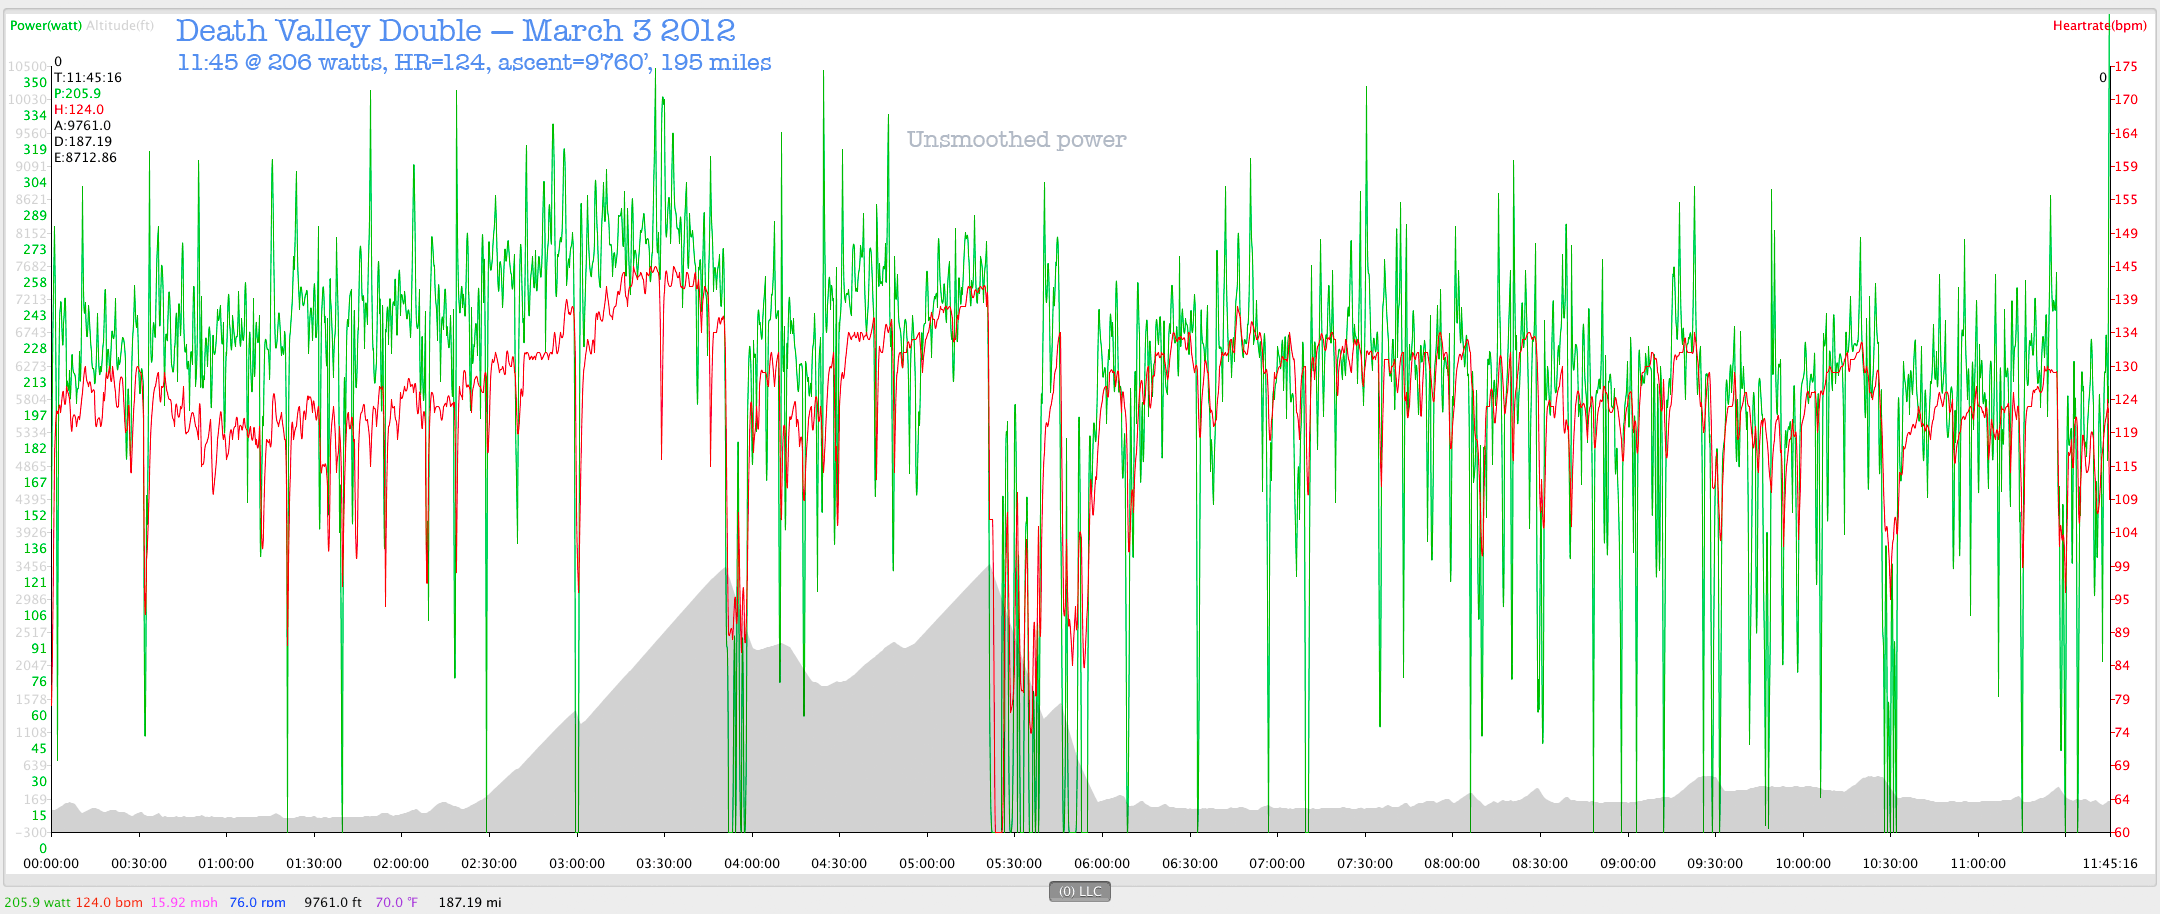
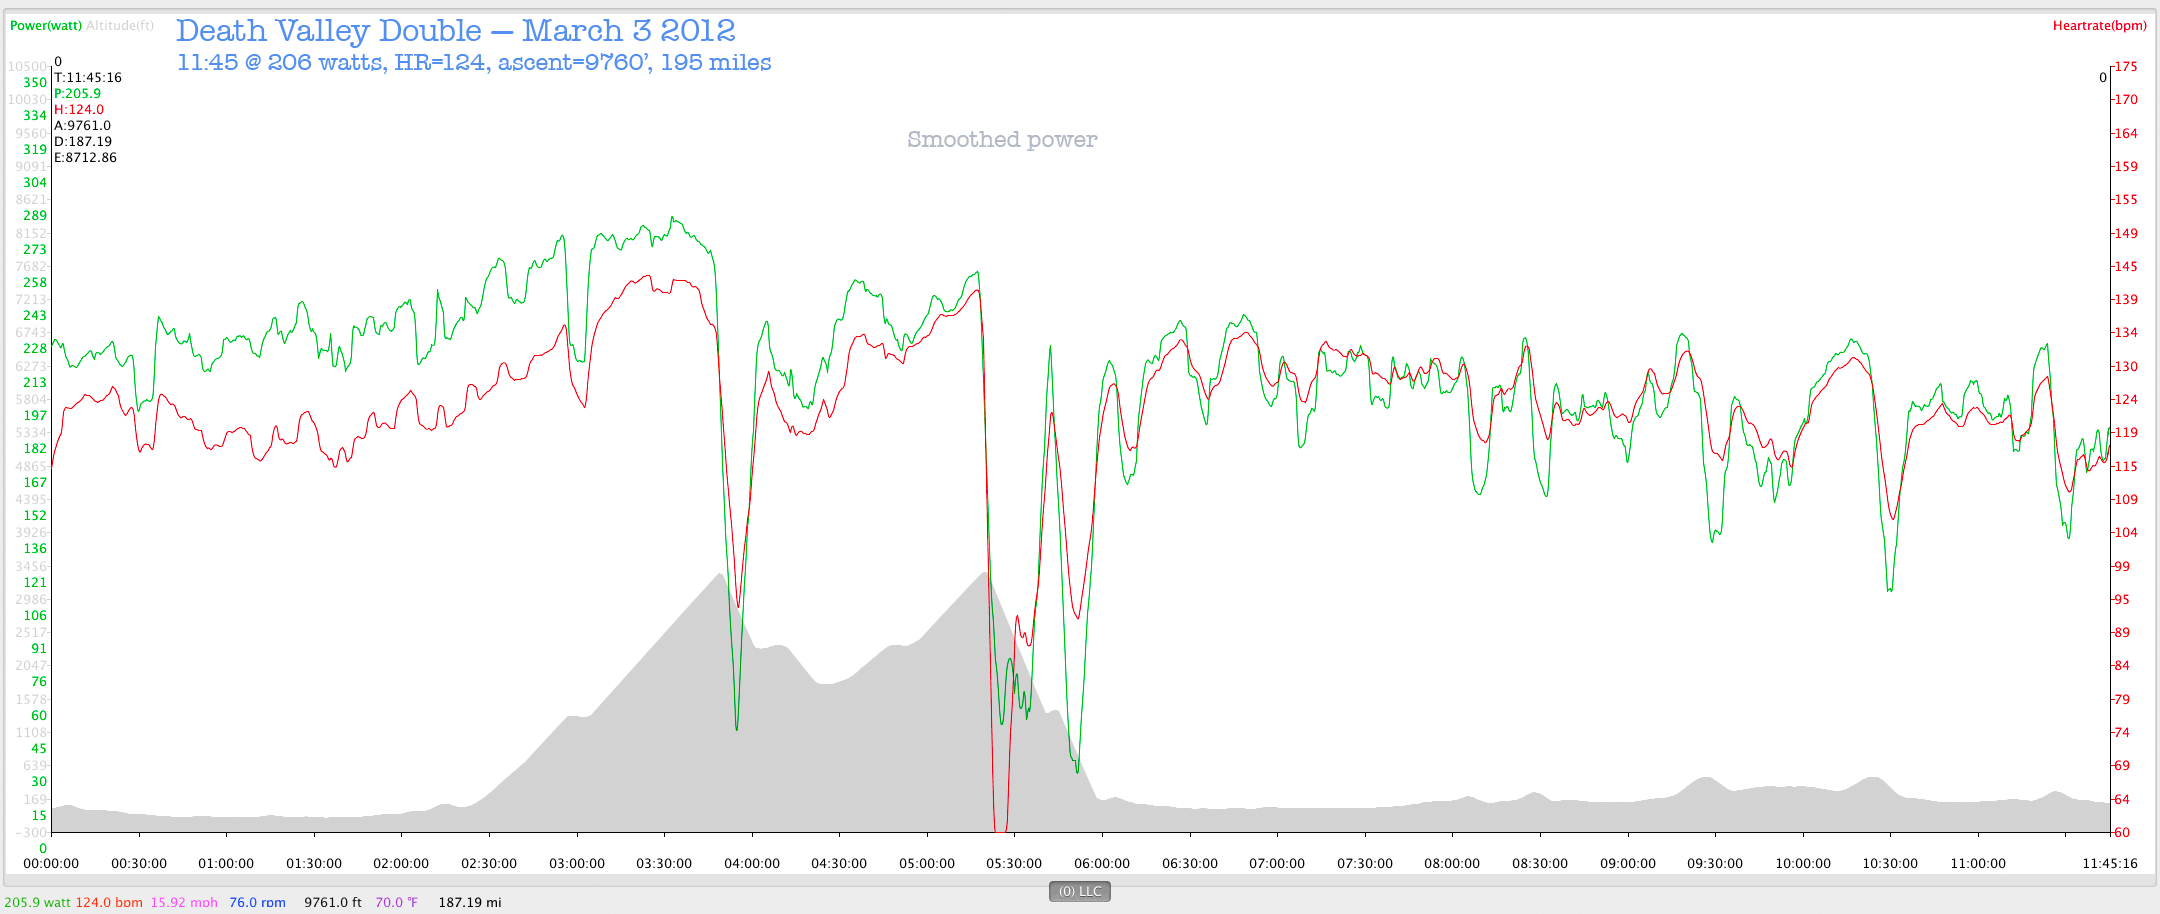
Even the minimum smoothing in the SRM Mac software (1%) hides power spikes and dips, which removes a lot of information about the actual workout intensity
In the example below, the smoothed graph shows that power never exceeded ~290 watts for the entire 12 hours (green line for power). Worse, the many power dips completely disappear in the smoothed graph. The minimum smoothing is still very heavy-handed.
The unsmoothed graph shows important insights into variability in the power output; the smoothed graph makes it appear that pedaling never stopped, even on 10 minute descents where pedaling was absent. This is highly misleading when analyzing power output.
It’s not clear what “1%” means in the context of an ~12 hour ride (does that mean smoothing 7.2 minutes out of a ~720 minute ride?). Perhaps. Because that would explain the loss of all highs and lows.
Smoothing really ought to be over some number of samples; one could choose 2, 5, 10, 30 second smoothing, and the resulting graph would then be much more revealing of the true effort, independent of the length of the exertion. Other graphical means could also be used to add subtle hints to the data “shape”.
Click for larger graphs.