


Everest Challenge 2012 Power Data
Related: bicycle power meter, Death Valley, Eastern Sierra, Everest Challenge, gear, hard core, heart rate, Inyo National Forest, peak bagging, Rock Creek, SRM, Veloflex, White Mountains
See Race Prep for the Everest Challenge as well as 9500' Is Not Sea Level, So Say My Lungs and Heart at Tioga Pass, Aerobic Energy at High Elevation.
Results for the 2012 Everest Challenge are in. I was #443, and took 5th place, being 27 seconds behind 4th place.
I rode the Moots Vamoots RSL with SRM Cannnondale SI/SL power meter, wheels the Lightweight Obermayer 20 spoke front and rear carbon fiber wheels, Veloflex Sprinter rear tire, Veloflex Record front tire and wore Giro Prolight SLX shoes with my usual Pearl Izumi In-R-Cool short and a full-zip jersey, which I unzipped fully most of the day.
Delta
My analysis of my times in 2012 vs 2011—
"-" means faster than 2011
"+" means slower than 2011
Bishop Creek/SL:    -2.3%
Pine Creek:         -3.3%
Rock Creek (full):  -9.5%
Glacier Lodge:   -3.8%
Death Valley Rd: +0.4%  (BUT 3.3 miles longer!!!)
Schulman:        +3.6%
Notes:
- For unknown reasons, I lost power on the top of DV and bottom of Schulman, including some brain-fade descdending Death Valley Road, which slowed my descent. This also shows up on the Schulman Grove climb as slower than 2011, where I was not moving optimally for the bottom 1/3 of the climb.
- My bike was 0.4 pound heavier. One pound (0.52% of total riding weight) computes to 3 minutes of race time on an assumed 10 hours (36000 seconds) of climbing. Hence 0.4 pounds more weight costs ~75 seconds over the whole race.
Power / heart rate / elevation profiles
The SRM barometric altimeter was reading low, and accumulated about 3000' too little elevation— no big surprise given the day’s swing in temperature, which affect air pressure greatly.
Power (watts, smoothed) is green, heart rate is red, elevation profile is gray. My SRM power meter (Cannondale SI/SL Compact) is the most accurate model, accurate to 1%, according to SRM.
Note that the Everest Challenge is a “ride extra hard to summit, scarf, recover on the downhill, repeat” type of race both days, which leads to appropriate hydration and fueling and pacing considerations.
Click for larger graph.
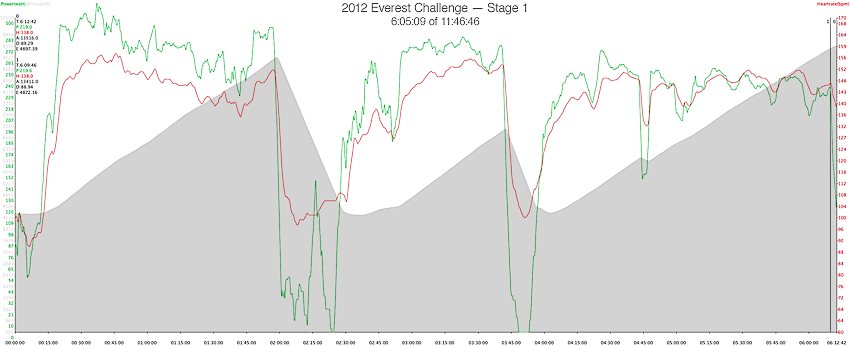
Bishop Creek / South Lake + Pine Creek + Lower Rock Creek and Upper Rock Creek
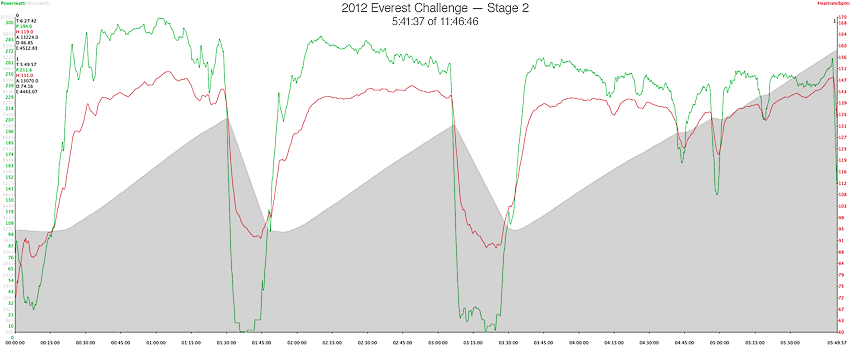
Glacier Lodge + Death Valley / Waucoba Rd + Schulman Grove
