


SARS CoV2 aka COVID-19: Trying to Make Sense of the Death Rates
Related: ethics in medicine, gears of the machine, health, influenza, SARS-CoV-2 aka COVID-19 aka Coronavirus
Read Kicking the Can Down the Road? first for background critical to this post.
UPDATE: since I wrote this, the numbers are even more compelling in support of the idea that COVID-19 itself a health care blip. What is NOT a blip is the overreaction that is killing people and degrading their lives.
...
The graph below offers perspective on the significance of COVID-19, but CAUTION in interpretation is needed as the graph is misleading both for and against concern over COVID-19, as per these notes.
Bottom line for those advocating to proceed based on “data and science”: the data is dubious at best at this point, tests are subject to high error rates, and the science of COVID-19 is largely unexplored.
REPEAT: data is data, but this graph is a good example of how data can mislead.
These notes are absolutely critical to judging the significance of the graph. DO NOT JUMP TO CONCLUSIONS ON THE GRAPH WITHOUT READING AND UNDERSTANDING THE NOTES.
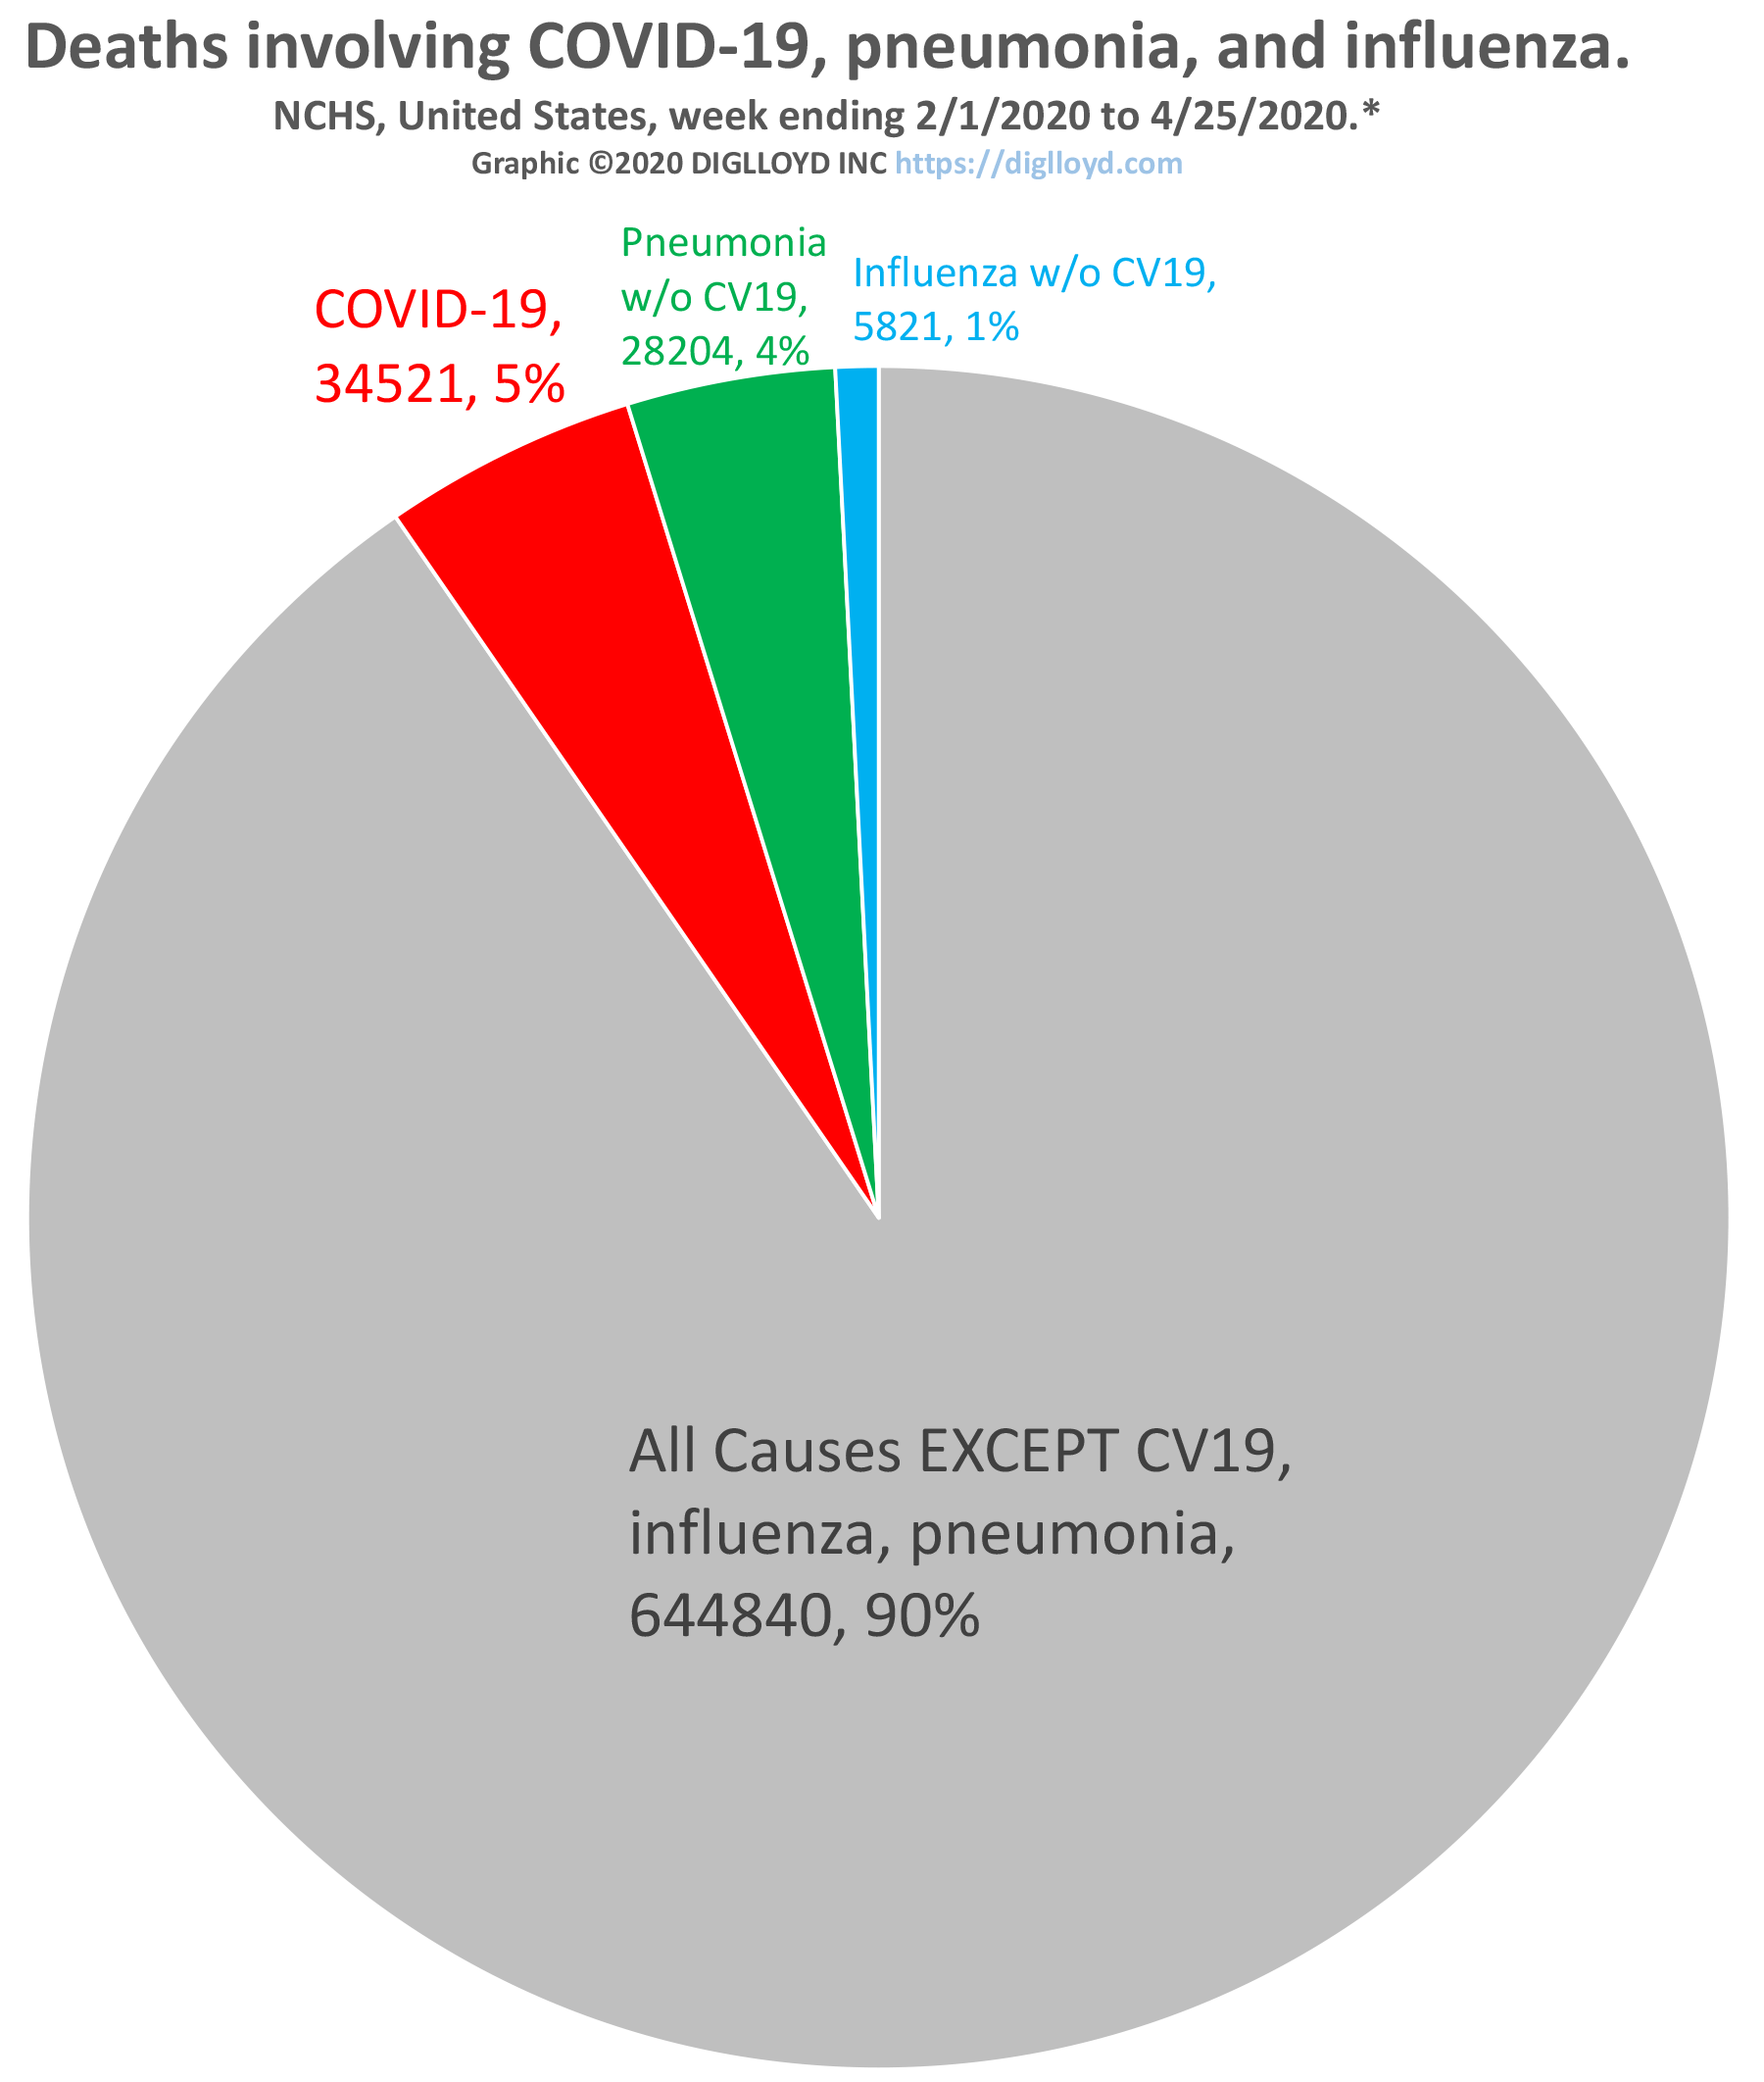
See larger graph below, and notes
- Total deaths is across the entire population of the country whereas COVID-19 deaths can stem only from those infected, which is a far smaller number than total population*. Thus the percentage (death rate) misleads until we know that most of the population has been infected. There is no reliable data on how many people have been infected with CV19 or influenza.
- COVID-19 deaths should be understood as “alleged COVID-19 deaths” because the diagnosis of death as COVID-19 is subject to non-medical pressures as well as ambiguity inherent with comorbidities. Thus the true number of deaths from COVID-19 is less than stated, but the true figure cannot be known, and perhaps not even defined in a fully objective way. Also, post-mortem diagnosis is not necessarily done consistently and may often simply be assumed.
- The true death rate for COVID-19 might be 1% or it might be 0.1% or something else entirely (no one knows because no none knows how many have been infected). And it might increase or decrease as we learn how to treat CV19 better and/or as our ability to treat declines (overwhelmed hospitals, lack of staff and supplies, etc).
- Death reporting lags, so the CDC data used for the graph is subject to that same gap in the CDC data itself.
- There is no reliable data on how many people have been infected by or have died from influenza, thus any comparison is just data masturbation. The CDC here in the USA makes estimates based on models. Models are for persuasion and extremely crude estimates, not validated by reality, and definitely not science. The COVID-19 data are similarly bad and maybe worse; death count may be too low or too high and no one really knows.
- It is unwise to assume an unchanging death rate: (1) were hospitals overwhelmed, the (as yet totally unknown) death rate from COVID-19 might rise for want of treatment options (or staff or equipment or supplies or etcetera), (2) seasonal health effects might change matters, (3) treatment options might see a breakthrough, etc. Odds are that the true death rate will be much lower than thought by the time this is over, so long as medical facilities are not overwhelmed.
- Regular pneumonia*** remains a big yearly killer and this year’s influenza looks very mild compared to COVID-19. BUT since most people are vaccinated for influenza and certain causes of pneumonia (with those most at risk most likely to be vaccinated), and we don’t know those infection rates, it’s not possible to make a valid comparison. Ditto for COVID-19—no one knows the actual number of people infected. It might never be known.
Crude analysis of future risk
With data so crude and science so lacking on COVID-19, there is no valid numeric argument to be made—models are for persuasion; they are not facts. And yet, adult decisions have to be made on total impact to everyone, which involves vastly more than how many people die from COVID-19.
Supposing a million people have been infected so far**, infection of 300 million people could be extrapolated to just over one million deaths over some number of months (years) until the disease fades out in the population (assuming immunity is possible and thus herd immunity).
Many of those who die from COVID-19 might have died of other causes soon—that’s just math, sad as it is, since those most likely to die from infection are also those most likely to die from other causes (see the CDC statistics by age group). Indeed, for those most likely to die from COVID-19 (the very old), expected lifespan may only be a year or two at best. So the COVID-19 death toll, as awful as it is, includes a very high proportion of people whose expected lifespan was already very short.
Looked at in life-years, the death of a 50-year-old expected to live to 90 is the loss of 40 years of life, versus 5 years for an 85-year-old expected to live to 90 (perhaps with a low quality of life). That’s no solace for those impacted, but it’s a mathematical truth. As both my parents are around 80 years old, it does not make me feel better about it, but I value my own life as a 55-year-old far more than as an 85-year-old.
* Infection rates both for COVID-19 and influenza are totally unknown. Only widespread randomized testing with a very low false positive and false negative test could us that. Also, the error rate for COVID-19 tests is high enough to make the data highly suspect.
** It could be that 1 million people have been infected, or 5 million, or something else entirely. Test accuracy for false positive and particularly for false negative has not been validated in any scientifically defensible way. Early research suggests a false negative rate of up to 30%, which makes infection data more GIGO than anything else. Error might have more to do with sample collection than the test itself, but both contribute. Other sites say 15%—net/net the tests are not very reliable to diagnose COVID-19.
*** pneumonia is a broad term: it may be viral or bacterial and have cofactors.
NOTES: except for death itself, most of this data from the CDC for influenza and COVID-19 is highly suspect. That is, influenza deaths are estimated by models. COVID-19 deaths are frequently based on assumptions or guesses, and may be quite a bit higher (up to 50%), or might be lowe and no one knows. Repeating the mantra of “data and science” for dealing with COVID-19 is a study in GIGO.
NCHS, United States, week ending 2/1/2020 to 4/25/2020.
Source: https://www.cdc.gov/nchs/nvss/vsrr/covid19/index.htm
