

Huge Spike in Deaths Per Day Following COVID Vaccination relative to Baseline Deaths
Related: ethics in medicine, gears of the machine, SARS-CoV-2 aka COVID-19 aka Coronavirus, vaccination
re: ethics in medicine
re: COVID-19
Can an MD or epidemiologist with appropriate skills or a data scientist or someone versed in such stuff please debunk these claims and this graph in a way that I can understand?
The methodology is stated in the paper in detail, as the source source dataset, etc. Whether it is bad assumptions, bad data, bad logic or some of all of that, please spell it out.
I understand some of the limitations already (VAERS reporting rate and its other shortcomings), but we are also subtracting out the baseline death rate.
Update Nov 1: no debunks and no protests so far.
NIH.gov: Why are we vaccinating children against COVID-19?
2021-09-14, Ronald N. Kostoff a, *, Daniela Calina b, Darja Kanduc c, Michael B. Briggs d, Panayiotis Vlachoyiannopoulos e, Andrey A. Svistunov f, Aristidis Tsatsakis g
This article examines issues related to COVID-19 inoculations for children. The bulk of the official COVID-19- attributed deaths per capita occur in the elderly with high comorbidities, and the COVID-19 attributed deaths per capita are negligible in children. The bulk of the normalized post-inoculation deaths also occur in the elderly with high comorbidities, while the normalized post-inoculation deaths are small, but not negligible, in children...
A novel best-case scenario cost-benefit analysis showed very conservatively that there are five times the number of deaths attributable to each inoculation vs those attributable to COVID-19 in the most vulnerable 65+ demographic...
...
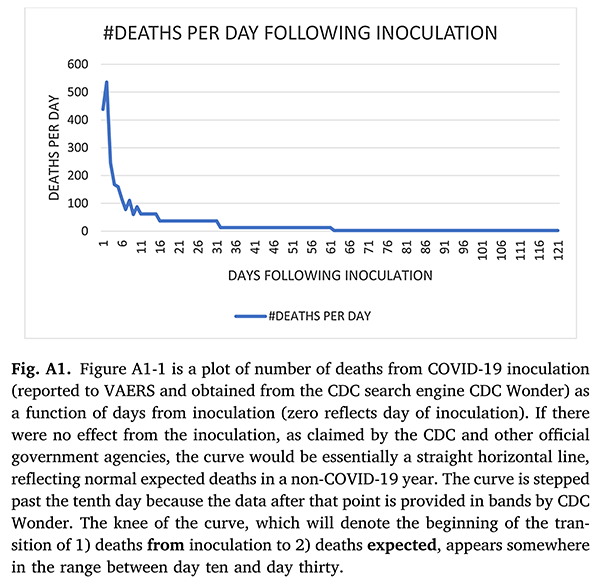
Fig. A1. Figure A1-1 is a plot of number of deaths from COVID-19 inoculation (reported to VAERS and obtained from the CDC search engine CDC Wonder) as a function of days from inoculation (zero reflects day of inoculation). If there were no effect from the inoculation, as claimed by the CDC and other official government agencies, the curve would be essentially a straight horizontal line, reflecting normal expected deaths in a non-COVID-19 year. The curve is stepped past the tenth day because the data after that point is provided in bands by CDC Wonder. The knee of the curve, which will denote the beginning of the tran- sition of 1) deaths from inoculation to 2) deaths expected, appears somewhere in the range between day ten and day thirty.