

Training Weight Loss: 2012 Case Study
Related: body fat, health, metabolism, nutrition, training
Legal disclaimer: Since we are not doctors, never follow anything based on health-related topics on this or related sites without first consulting with your doctor or other trusted health professional.
For how I approach my weight (fat) loss goals, see Training Weight Loss: Tracking Calories (Diet) and Training Weight Loss: Tracking Body Weight.
In early 2011 I set myself a goal of losing at least one pound of body fat per week. I exceeded that goal in 2011: 26+ pounds of body fat gone in 130 days.
For 2012, I realized that to have any chance at winning the Everest Challenge (men’s Masters 45-54), I would have to get lean, very lean, as in 8% body fat is excessive.
In 2012 at 170 pounds, the DEXA scan showed 7.9% body fat. Dropping to 6% body fat would save about 3.4 pounds, or about 10 minutes. That might be the difference between 1st place and 3rd place. On the other hand, getting really lean without losing muscle mass or power could be a challenge. Uncharted territory for me.
Sept 10, 2012
Physiological push back— the 169 mark just does not want to be broken, even though I’ve been running a caloric deficit for a few weeks. The body adapts to avoid starvation apparently. The issue is strength— running a caloric deficit seems to require a very careful balancing act to maintain strength (weight loss by itself can be destructive if muscle and power is lost). The other issue is daughters that bake a lot of cookies— pure willpower is demanded, and not always successful.
Click for a larger graph.
Click for larger graph
Graphing calories vs weight
Early May represents a very aggressive attempt to shed fat fast. It is very important to monitor recovery and strength when attempting such things. Increased demands on the body require extra rest and sensible eating to avoid issues, and this might also require being close to calorie neutral some days. Reduced power and increased fatigue are a clue to back off, let the body recover, then whack it again.
My approach is simple: average an ~1800 calorie per day “burn”, with a caloric deficit averaging ~500 calories per day. The high burn rate makes it much easier to run a caloric deficit, since I can still eat plenty of food, yet not feel too hungry, especially with the right food choices. Recovery drinks like Hammer Recoverite and high quality protein like Hammer Whey are essential nutritional tools.
Once a desired weight is reached, it is easier to “eat to parity” each day (no caloric surplus or deficit, on average). The body still exerts its grumpiness over such things (easy to eat more), but it is easier to manage.
Asymptotic fat loss
It is easy to drop body fat when there is an excess of it, as my 2011 efforts show clearly in the body weight graph— 40 pounds of fat burned off, ~12 pounds of muscle gained, as per the DEXA scan history.
It gets much harder as body fat percentage drops.
The body (brain I suppose) is designed by evolution to not allow starvation. As body fat declines, appetite becomes a powerful force to encourage the dummy in charge to EAT. The body also starts exracting every last calorie it can from all food as well as making other mysterious adjustments, trying hard to keep fat stores intact. So the “calories in vs calories burned” game is not at all linear and is a naive assumption, a moving target on the “calories burned” end.
When my body fat drops below 10%, I find it difficult to average more than a 400 calorie per day deficit, and even that takes considerable discipline on both the exercise and eating fronts.
As my body fat drops towards 8%, a 200 calorie per day deficit is as hard or harder than the 400 calorie deficit was at ~10% body fat. Below 8% is unknown territory (7.9% reached in 2011).
It just keeps getting hard, and the deficit graph I developed for 2011 shows the asymptotic convergence of calorie deficit from Jan - September 2011. That was a forced convergence by the body’s own survival mechanisms, not anything I planned on.
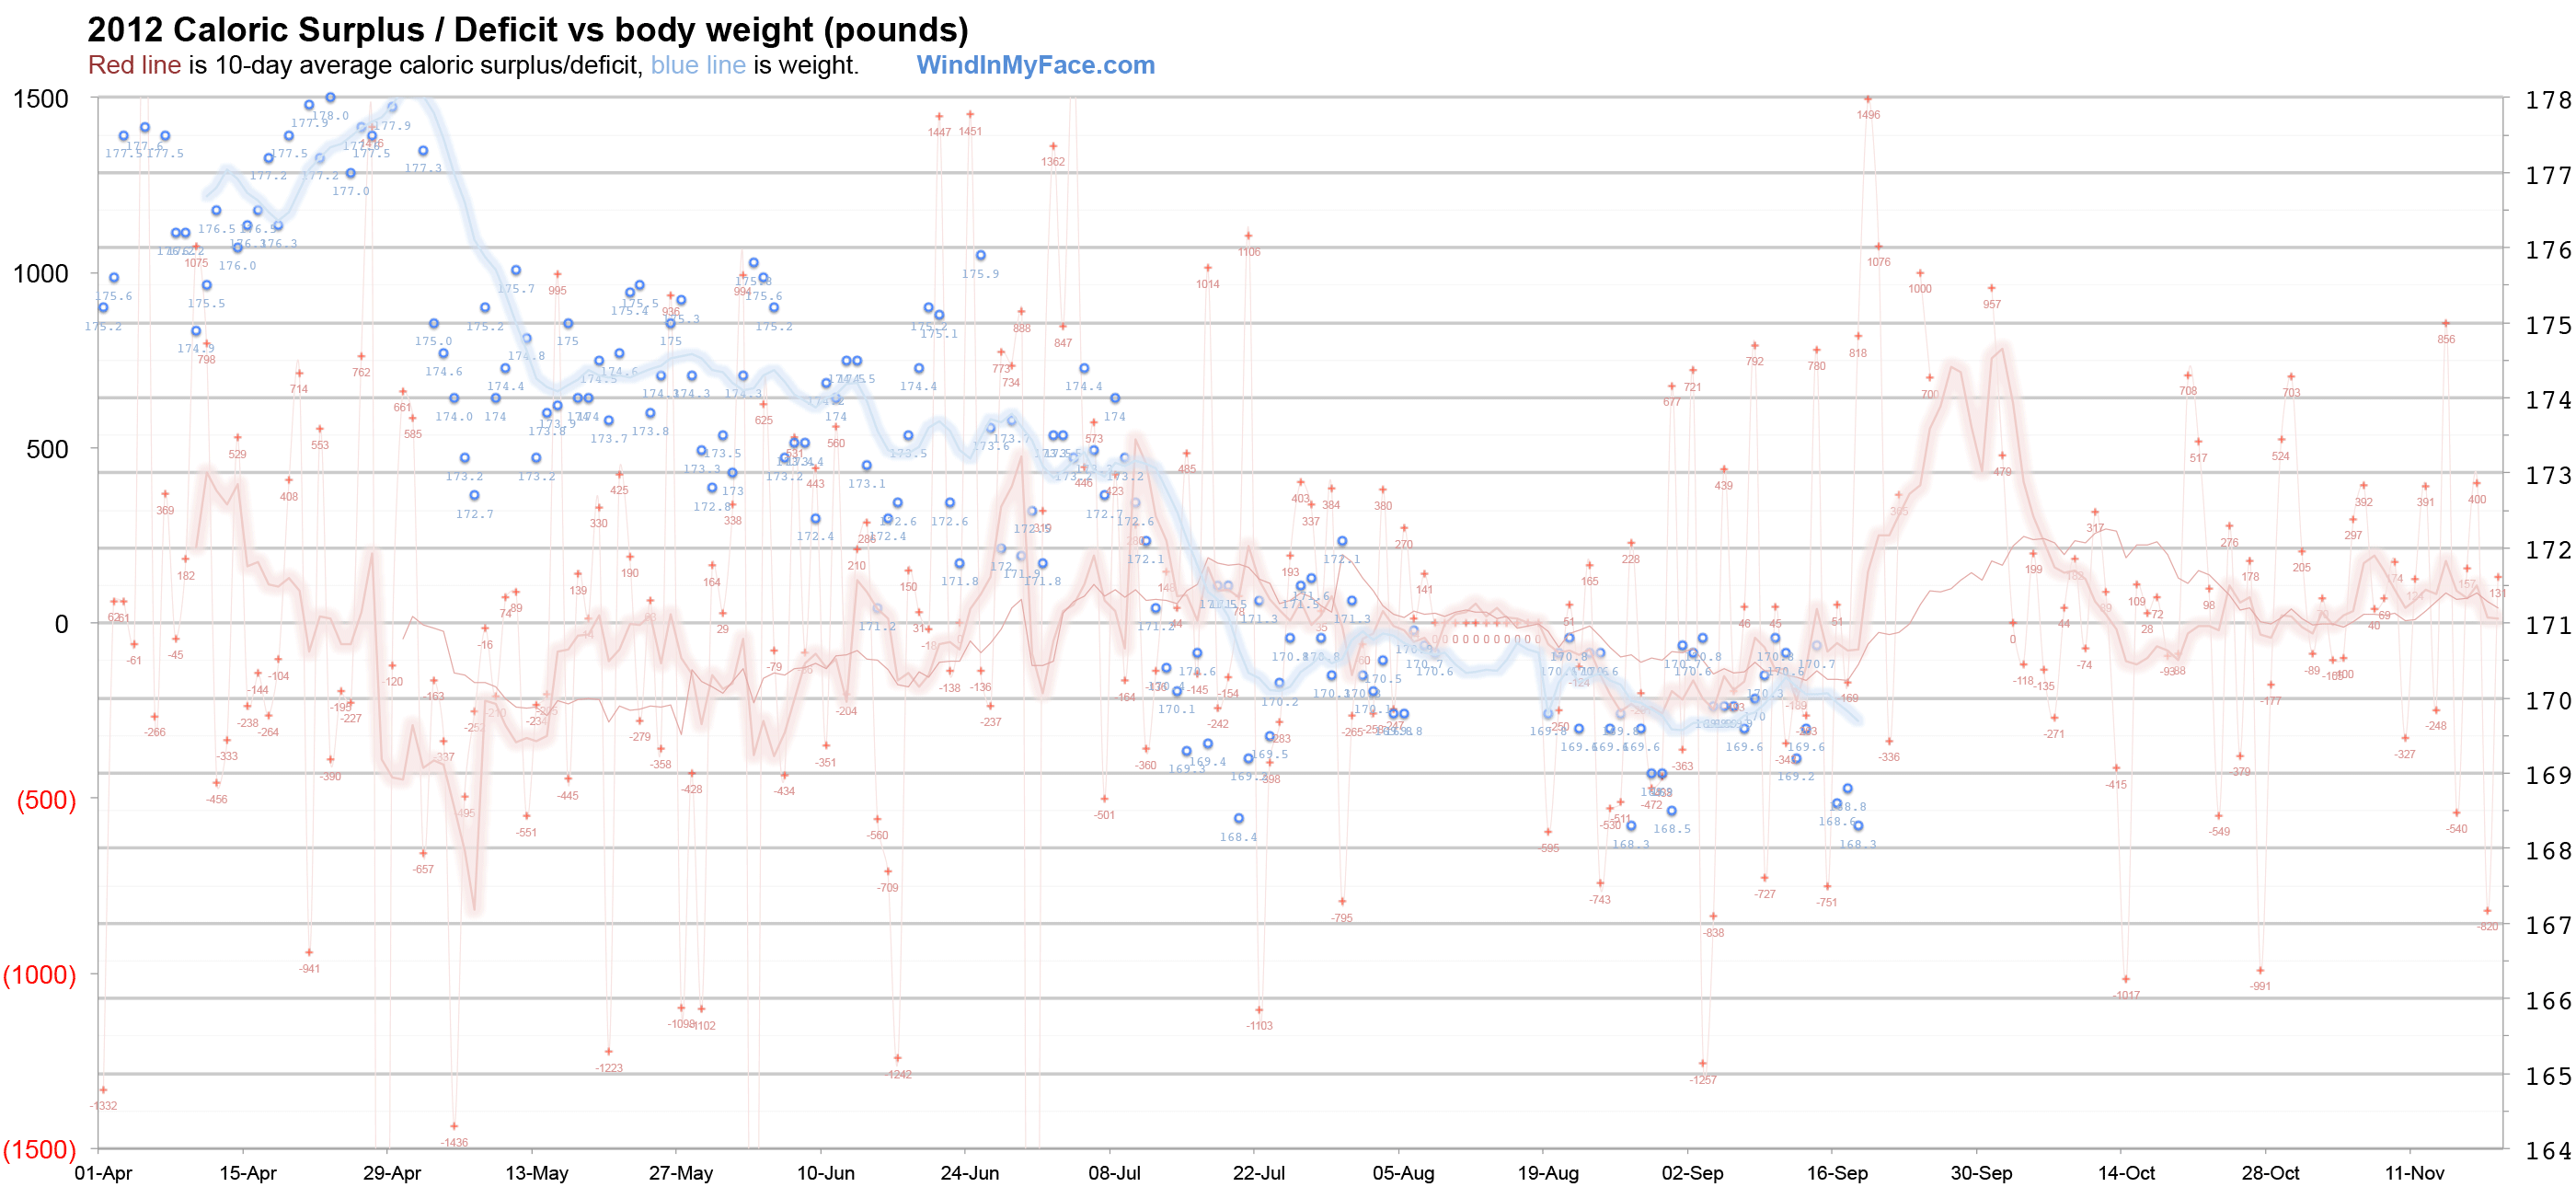
Body weight in the graph
The blue triangles show body weight (which can vary each day by up to several pounds), but the trend is what counts. Which is why weighing every day and graphing are the only sane way to approach it, a positive feedback loop when things are going well.
I launched my aggressive “race weight” effort following the Devil Mountain Double, which generated a 6300-calorie deficit on April 29. Note the weight spike the next day (April 30); this is a normal physiological response after a grueling effort.
Pushing body fat below 10% is really, really hard. All sorts of physiological barries start pushing back: hunger, the body gets more efficient, “set point”, etc.
Ultra-high performance across entire capacity, outperforms the competition.
Tiny, bus-powered, rugged, compact!

Caloric surplus/deficit in the graph
The straight red line is caloric parity, the zero line for net calories.
The variable red line shows the average caloric surplus or deficit. When the red line dips below the calorie zero line, then weight loss should occur, the goal being fat loss without muscle loss, or ideally muscle gain— that’s the trick!
The variable blue line is morning body weight, with the scale at right.
Click for a larger graph.
Notes
See May 15 progress report and June 15 progress report.
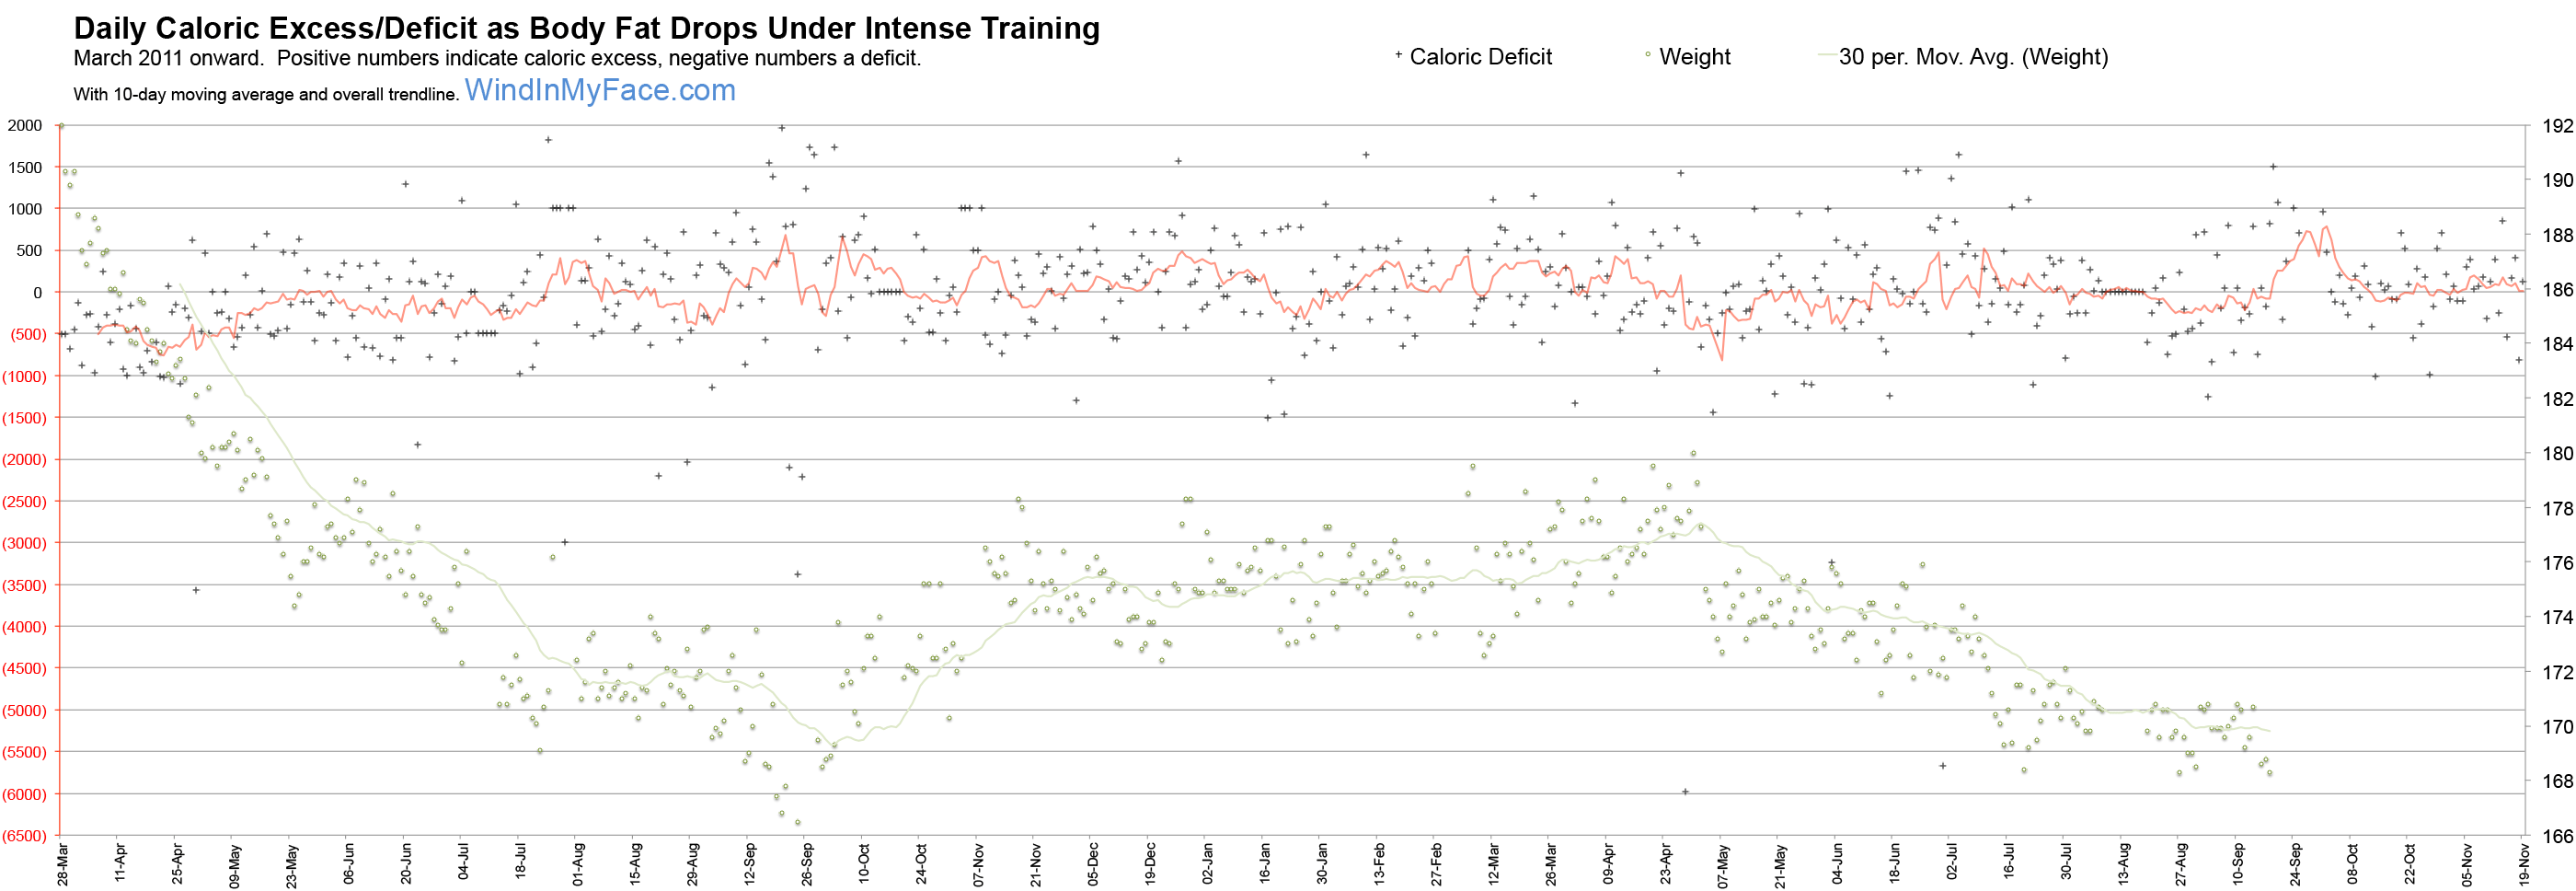
Longer term graph
Starting March 28, 2011. Even higher deficit in the Jan - Mar 2011 timeframe (not shown, detailed tracking not started until March 28, 2011). I found I could not achieve this deficit in 2012— lower body fat makes it harder and harder.
Click for a larger graph.