


$220 SAVE $130 = 37.0% Western Digital 16.0TB Western Digital Ultrastar DC HC550 3.5-in… in Storage: Hard Drives
|

|

|
|

|
3DBikeFit.com — Power Output (Wattage) with Bike Fit Changes
Related: 3DBikeFit.com, bike fit, heart rate, Moots, training

Using my SRM power meter on my Moot Vamoots RSL road racing bike, I repeated a standard workout on three consecutive days following the fitting at 3DBikeFit.com. This workout was one I had ridden at least 60 times over the course of 2012 (by itself or as a portion of another ride).
The fit just felt right in terms of being able to spin smoothly, and right away I observed power output up +20 watts or so over what I would normally expect for the perceived effort. It was a little surreal seeing power figures pop up that seemed, well, high for what I perceived as my exertion level.
Still, I figured initial excitement might influence my objectivity, so I waited to see whether days 2 and 3 would replicate the experience. Not only did it replicate, I used time and distance metrics to rule out the dubious chance of a power meter fluke— all three consecutive efforts matched or exceeded distance traveled with previous efforts in 2012.
This workout was my most common workout for 2012, and so I have a lot of data over the course of the year for it, showing steady improvement (power) over the year and providing a set of reference data. It is not a time trial, but rather a moderate workout that leaves me feeling vigorous, not worn out.
Power graphs
There is no question that the power gains are real, and that they accrue from a more efficient power stroke utilizing the most powerful muscles in the body more than prior to the bike fit changes. In fact, I noticed slight soreness resulting from the change in both the gluteus and the big section of the quads, but recovery seems to be quick, by the next day. Big and powerful muscles tend to recover quickly, a major advantage in itself.
Analysis follows below.
Day 1 (following bike fit changes) — moderate
Things feel a little odd compared to the old bike fit, but generally feel good and the pedal stroke is smooth.
Apparent heart rate interference so it cannot be used as an average here.
Day 2 — moderate
Similar to Day 1, but feeling more adjusted to new fit.
Apparent heart rate interference so it cannot be used as an average here.

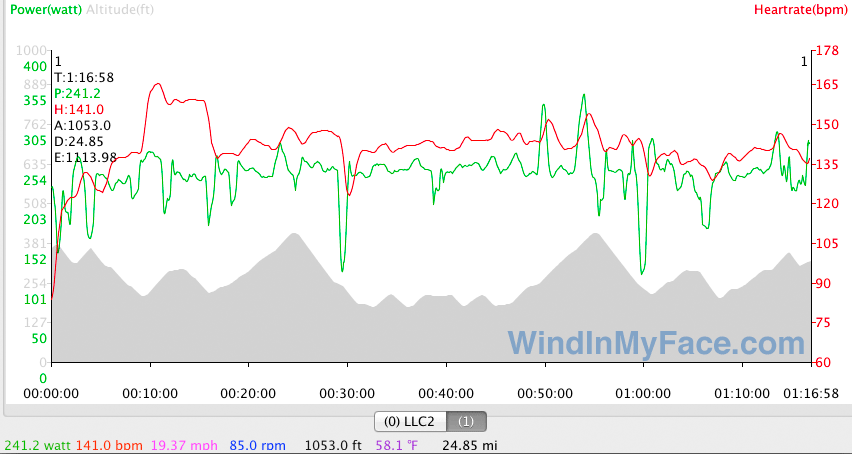
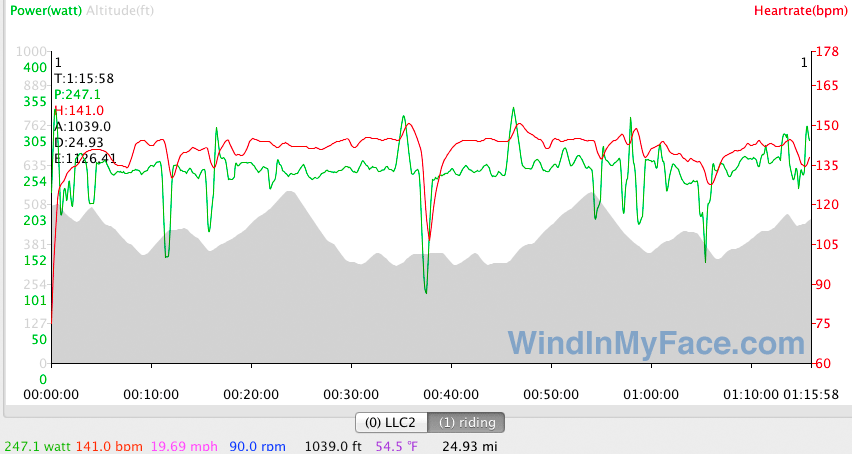
Day 3 — moderate+
Day 3 below is the highest power output I recorded in 2012 for this workout at moderate effort (as this was written). Yet it was not a hard effort, and did not require special concentration.
Apparent heart rate interference so it cannot be used as an average here.
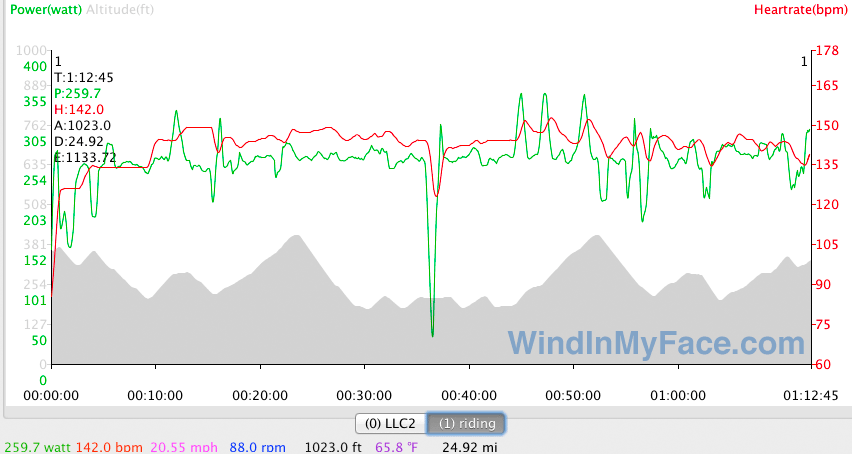
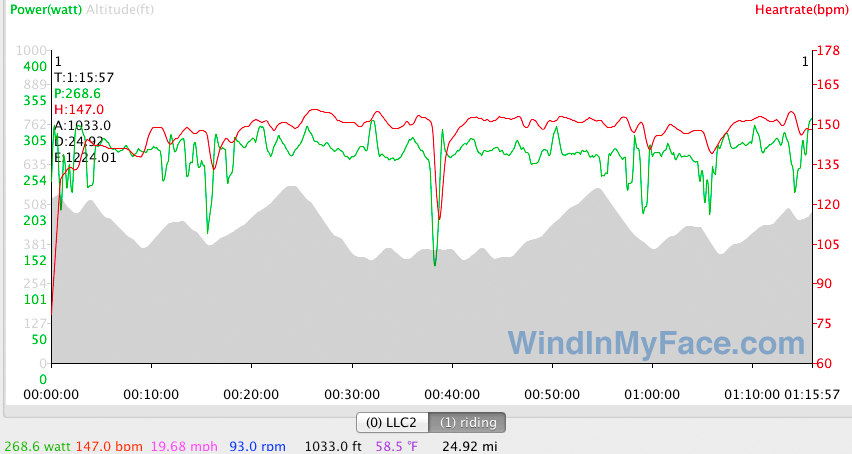
Day 4 — lactate threshold
OK, I’m a bad “patient”— in theory with a new bike fit going this hard is a bad idea (potential injury). However, since I ride my cyclocross and mountain bikes, my riding positions vary and my muscles seem to have needed little adaptation to feel comfortable, my cross bike in particular being fairly similar to the new fit.
I am feeling really good about this change. The power output is a bit ridiculous, at what feels like low effort I’m seeing 240 watts. It feels great. Recovery has been excellent.
Graphs— mileage and altitude varies slightly versus other graphs; there is a slightly variable start/finish point and elevation gain is always a little variable.
This was a lactate threshold workout, moving the intensity rating to “very hard”, requiring steady focus to maintain power. Not a maximal effort, but a very hard one.
I am sure I could improve here— possibly less than full lung function by a few percent (mild asthma, untreated), and not fully recovered and rested (see three previous days), but (butt?) feeling good. Cutting the time to an hour from 1:06 would enable slightly higher effort also.
- More miles in the new riding position should enhance neuromuscular adaptation and muscle growth in the big muscles = more watts over time.
- Very positive feedback loop in seeing these gains, very exciting.
- Cadence was quite high compared to other 2012 efforts— average cadence of 93 rpm, perhaps 10 rpm higher than usual. With a more efficient spin, it is easier to maintain a higher cadence, and the higher cadence felt appropriate (and necessary) to be able to maintain 300+ watts.
- This is a 1:06 effort, so it’s fair to say that my lactate threshold is 310 watts; I could have pushed out a bit more power for sure, especially for one hour instead of 1:06.
- Cadence was hitting 100-110 for significant periods. This reflects the smoothness of power transfer with the new setup. I could do this before, but not very long and not as smoothly.
- Average heart rate was 89.3% of my max (178), but but 178 is a questionable brief spike figure (and dizzy territory), true max is typically 171-175 under cool well-hydrated conditions, which means it’s more fair to say 91-93% of max for the effort, which corresponds to the natural limit for a well-trained athlete for an event of this duration.
- The downward spikes correspond to stop signs and the like.
Heart rate data (red line) appears to be valid (free of interference) here.
Click the graph for a much larger version.

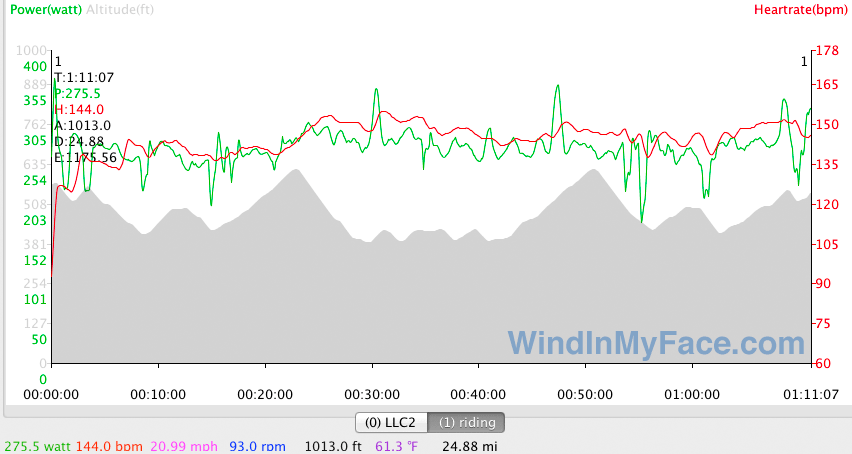
Day 5 — recovery (in theory)
This should have been in theory a recovery day. I went out thinking “be a good boy, just do 220 watts”. After yesterday’s hard effort my legs felt just slightly stiff at first (probably from sitting in a chair for 6 hours), but on the bike I was immediately soaring over 300 watts without even farting hard, so what the heck the body says “feels good”, so why not exult in a fabulous warm and sunny late November day.
LOL — today felt like I had a flywheel spinning my legs! No sense of fatigue from yesterday, and hardly any perceived effort. Apparently with big ass muscles getting used (that’s a double entendre), recovery is much faster. Arriving home, no sense of fatigue at all.
With the new bike fit my cadence is a whopping 15 rpm faster; I checked past records for this workout, and I was typically in the 76-81 rpm range, with 78 being average.
I have been watching my body position and my feeling is that I’ve been adapting very quickly. Minor issues include triceps fatigue from being in the drops most of the ride (very comfortable in the drops now), and some mild foot discomfort with the two higher wattage rides, which might just be all that wattage going through the foot and not being used to it.
Day 6 — body says enough
Legs had no overt soreness, but were somewhat stiff and did not want to spin as freely as the previous five days— the workout intensity has caught up with me.
The weather was colder, and wearing medium weight tights that impeded leg movement made spinning feel less smooth and easy (some muscle stiffness and the tights combined). Day 7 needs to be no workout, or 1/2 workout and/or maybe mountain bike instead.
Day 10 — finally a break in the rain
Monsoon-like rains for four days kept me off the road bike. During a 5 day period, I rode MTB the first day, 3 days off, then MTB. Following that is this workout on the road bike, so plenty of rest.
Analysis
These four back-to-back workouts were not just unusual individually in terms of power output and distance traveled, being at the very high end of the range for this particular workout— they were performed consecutively, showing unprecedented sustained power output at lower perceived effort. And this is without my muscles adapted to the new riding position (first three days after the bike fit changes).
Prior to the bike fit changes, recording these consecutive workouts at this power level would have been possible, but it is my sense that it would have required notably higher perceived effort, and resulted in lagging recovery. And the fact is, it never happened in 2012, not at these power levels (typical workouts were 20-30 watts lower).
- The first day at 241.2 watts is already at the top end of the power level at which I would normally ride this workout. The hardest effort for 2012 was 245 watts, but that workout involved many more peak sprint-type efforts, skewing up the average power.
- The second day (242.1 watts) essentially matched the first day. Well, this is a BIG DEAL because the power output of the first day would normally have had some negative effect on recovery (based on past experience in 2012).
- The third day (259.7 watts) blew way all prior 2012 efforts for a moderate effort.
- The fourth day (308.7 watts) shows that the riding position at lactate threshold is working great. It was a faster and more powerful performance than any other execution of this ride, ever.
- The fifth day (275.5 watts) just felt great— fast spin and no sense of having done a very hard workout the day prior.
- Overall, my 2012 data suggests a wattage increase of 20+ watts, rising to ~240-260 watts, up from ~210-240 watts.
To be conservative, call it 5%: that still means saving 30 minutes in the Everest Challenge and being within six minutes of 1st place in 2012 (had these power gains been in place). WOW! Beats saving a few grams on the bike.
Seagate 22TB IronWolf Pro 7200 rpm SATA III 3.5" Internal NAS HDD (CMR)
SAVE $100
