


A Fascinating Analysis of Multi-Month Caloric Deficit With Respect to Body Fat
See yesterday’s post on body weight set point.
This is a fascinating graph, one that I have never before seen discussed or documented in this way. It is based on months of my precise (to the gram) caloric tracking relative to exercise calories accurately measured, e.g., caloric excess/deficit day by day.
The graph trendline shows that the body adjusts its caloric intake as body fat stores are depleted (by increasing appetite), making it increasingly difficult to lose weight (body fat) as body fat levels decrease.
Click to read more.
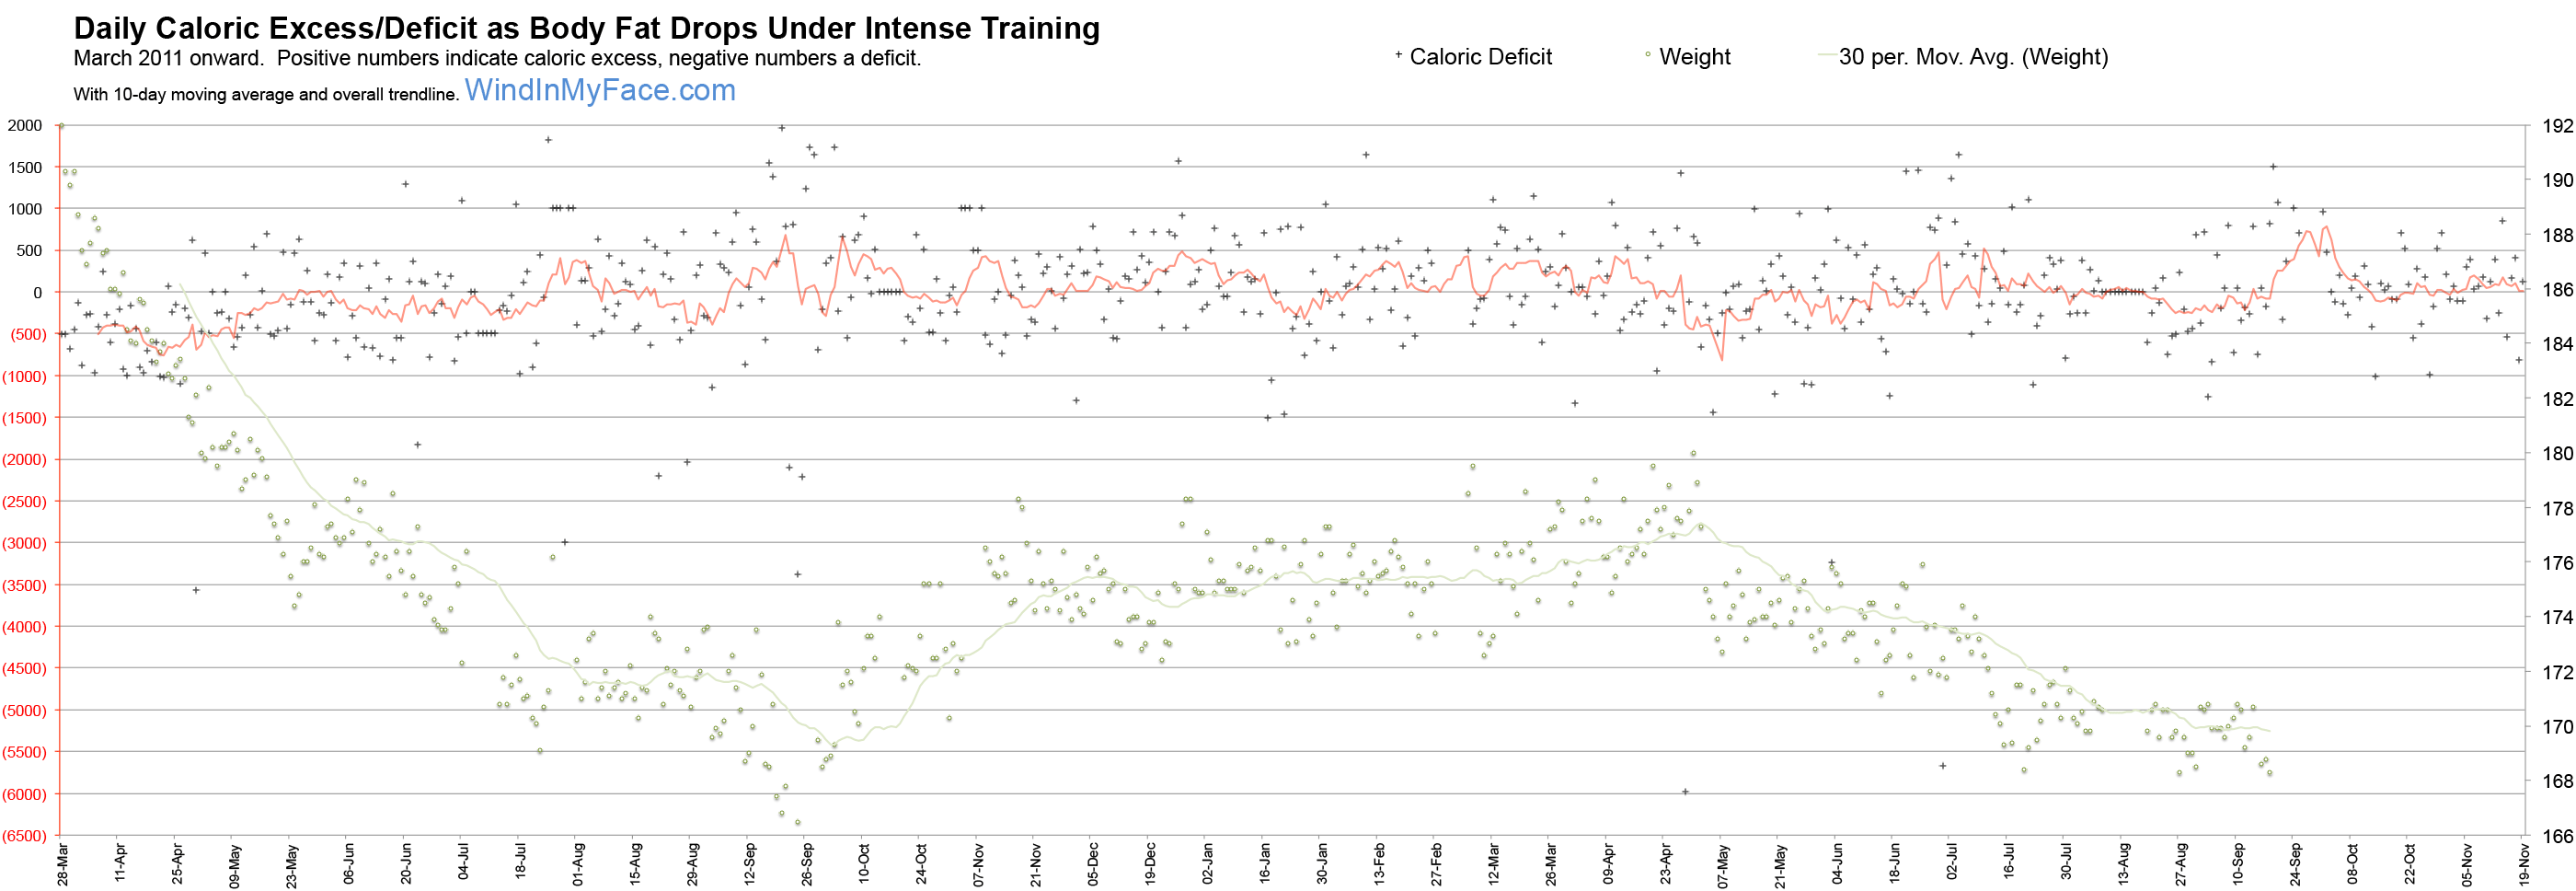
Daily caloric excess or deficit while losing body fat over a multi-month period
