


$220 SAVE $130 = 37.0% Western Digital 16.0TB Western Digital Ultrastar DC HC550 3.5-in… in Storage: Hard Drives
|

|

|
|

|
Training Weight Loss: Caloric Deficit
Legal disclaimer: Since we are not doctors, never follow anything based on health-related topics on this or related sites without first consulting with your doctor or other trusted health professional.
Below is a fascinating graph that I developed while training for the Everest Challenge. Discussion follows.
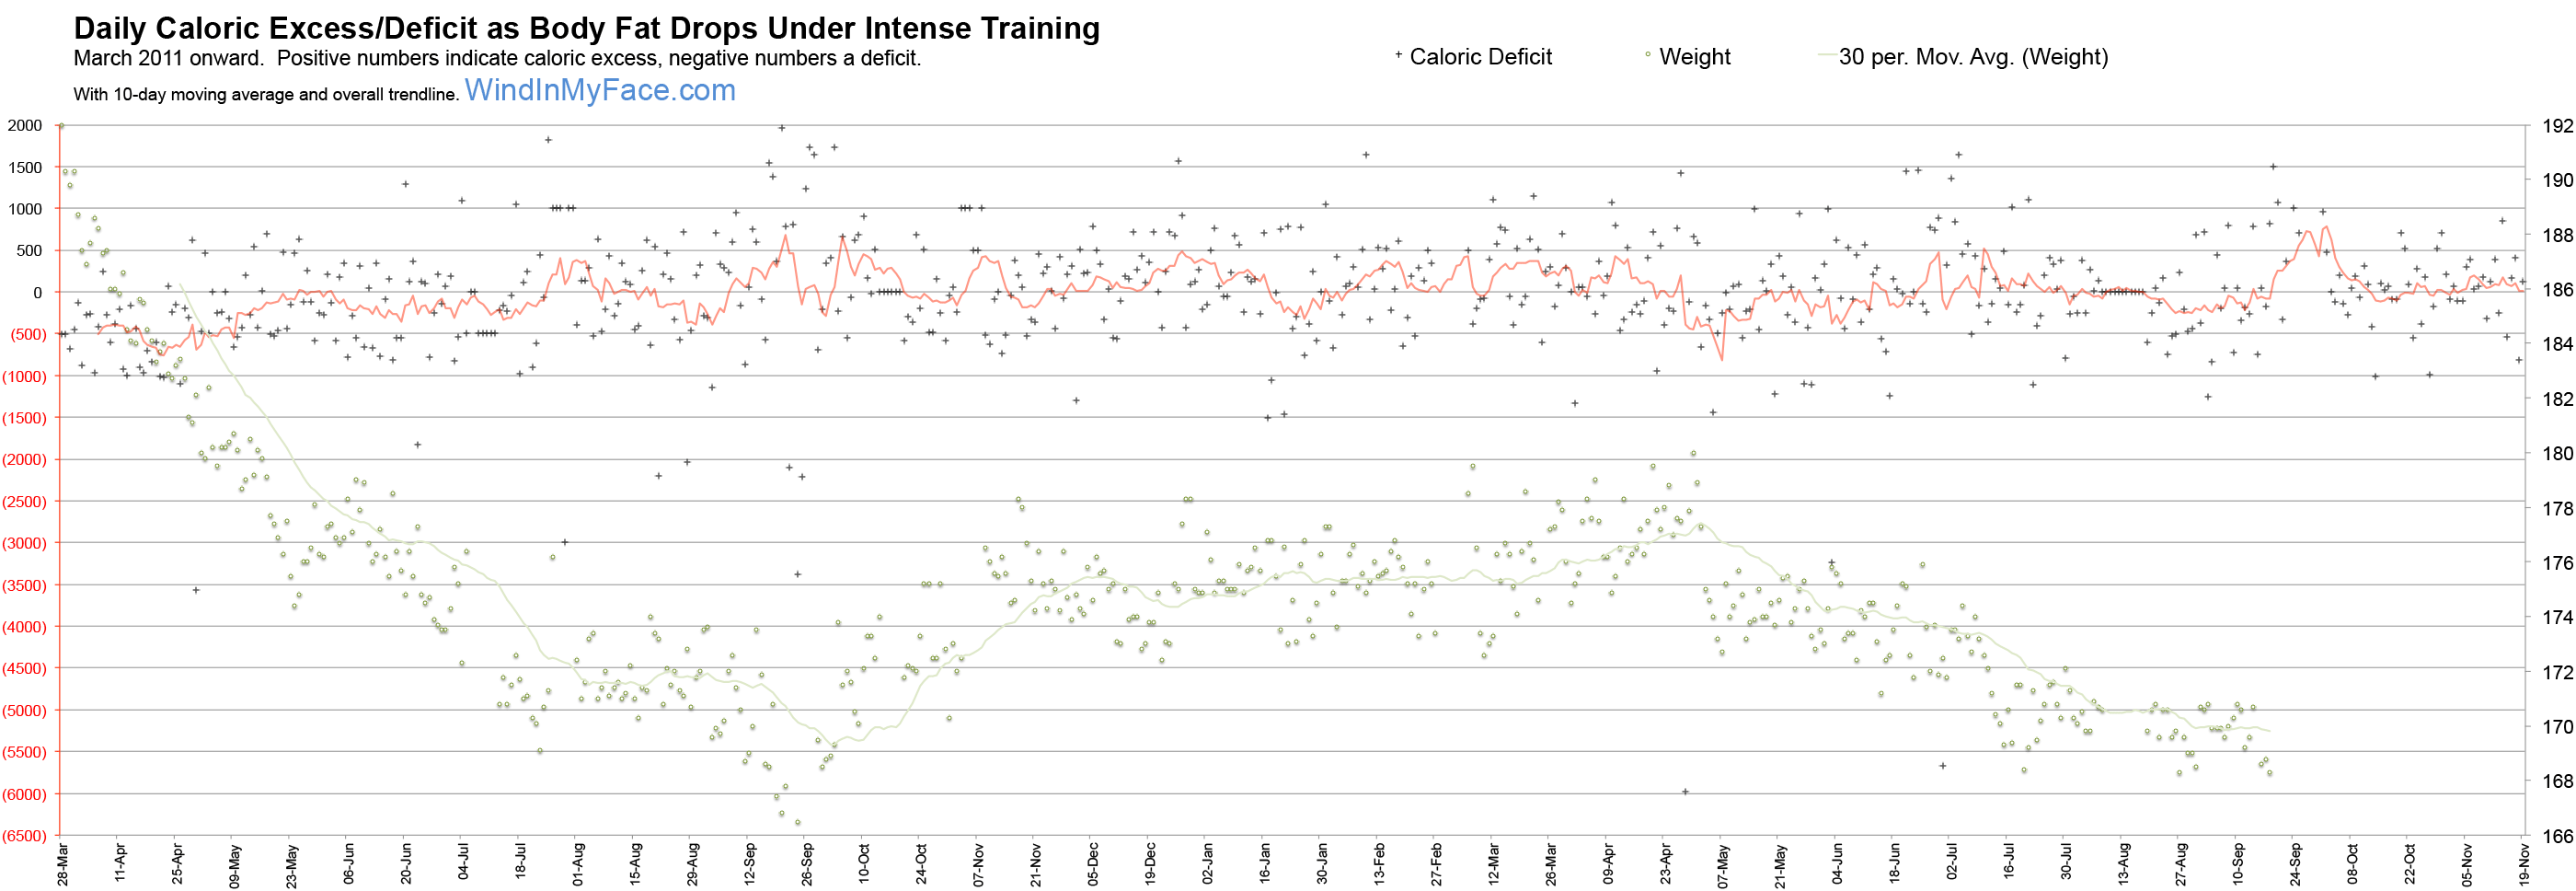
What it illustrates is how the body has a “set point”, gradually adjusting appetite so as to protect fat stores from being depleted to zero! A survival mechanism.
I was completely unaware of this trend until I graphed it, sensing only that initial weight loss (fat loss) was easy to accomplish simply by eating less than I burned off.
But after five months of intense training, appetite increased substantially— my body was demanding more calories after losing about 40 pounds of fat, as proven by the DEXA scan. The calorie deficit each day has continued to narrow to zero, with no conscious control of the trend on my part.
Exactly how to break through this appetite-resistance issue is unclear, because salads, etc do not seem effective in tricking my system into accepting bulk as a substitute for calories. Ramping up daily exercise to an average of over 1600 Kj per day helps maintain a somewhat larger caloric deficit with less discipline, but it’s also clear (via appetite) that the system has its own exquisitely unforgiving assessment of how much it’s being cheated, and how much time remains before starving— a set point statis must be maintained.
Red (negative) numbers are a caloric deficit. Body fat ranges from 20.6% on March 28 to 7.9% on September 13, as determined by a DEXA scan, with early October 2011 bringing something close to 7%.
The upward trend in late September 2011 was deliberate: extra calories the week prior to the Everest Challenge to ensure full recovery. Even so, weight dropped during that week, showing that short term inputs do not necessarily change body weight; the body might use those calories to build more muscle (for example), or to catch up on deferred repairs, or to deal with other stresses, such as high altitude causing demands for more red blood cells.
Note accounted for in the deficit calculation are the increasing caloric demands to maintain ~12 pounds more muscle tissue than at the start of the year (muscle tissue takes calories to maintain). The nominal caloric requirements for body needs were fixed at 2100 calories per day for the purposes of this graph.
Click to see a larger graph.
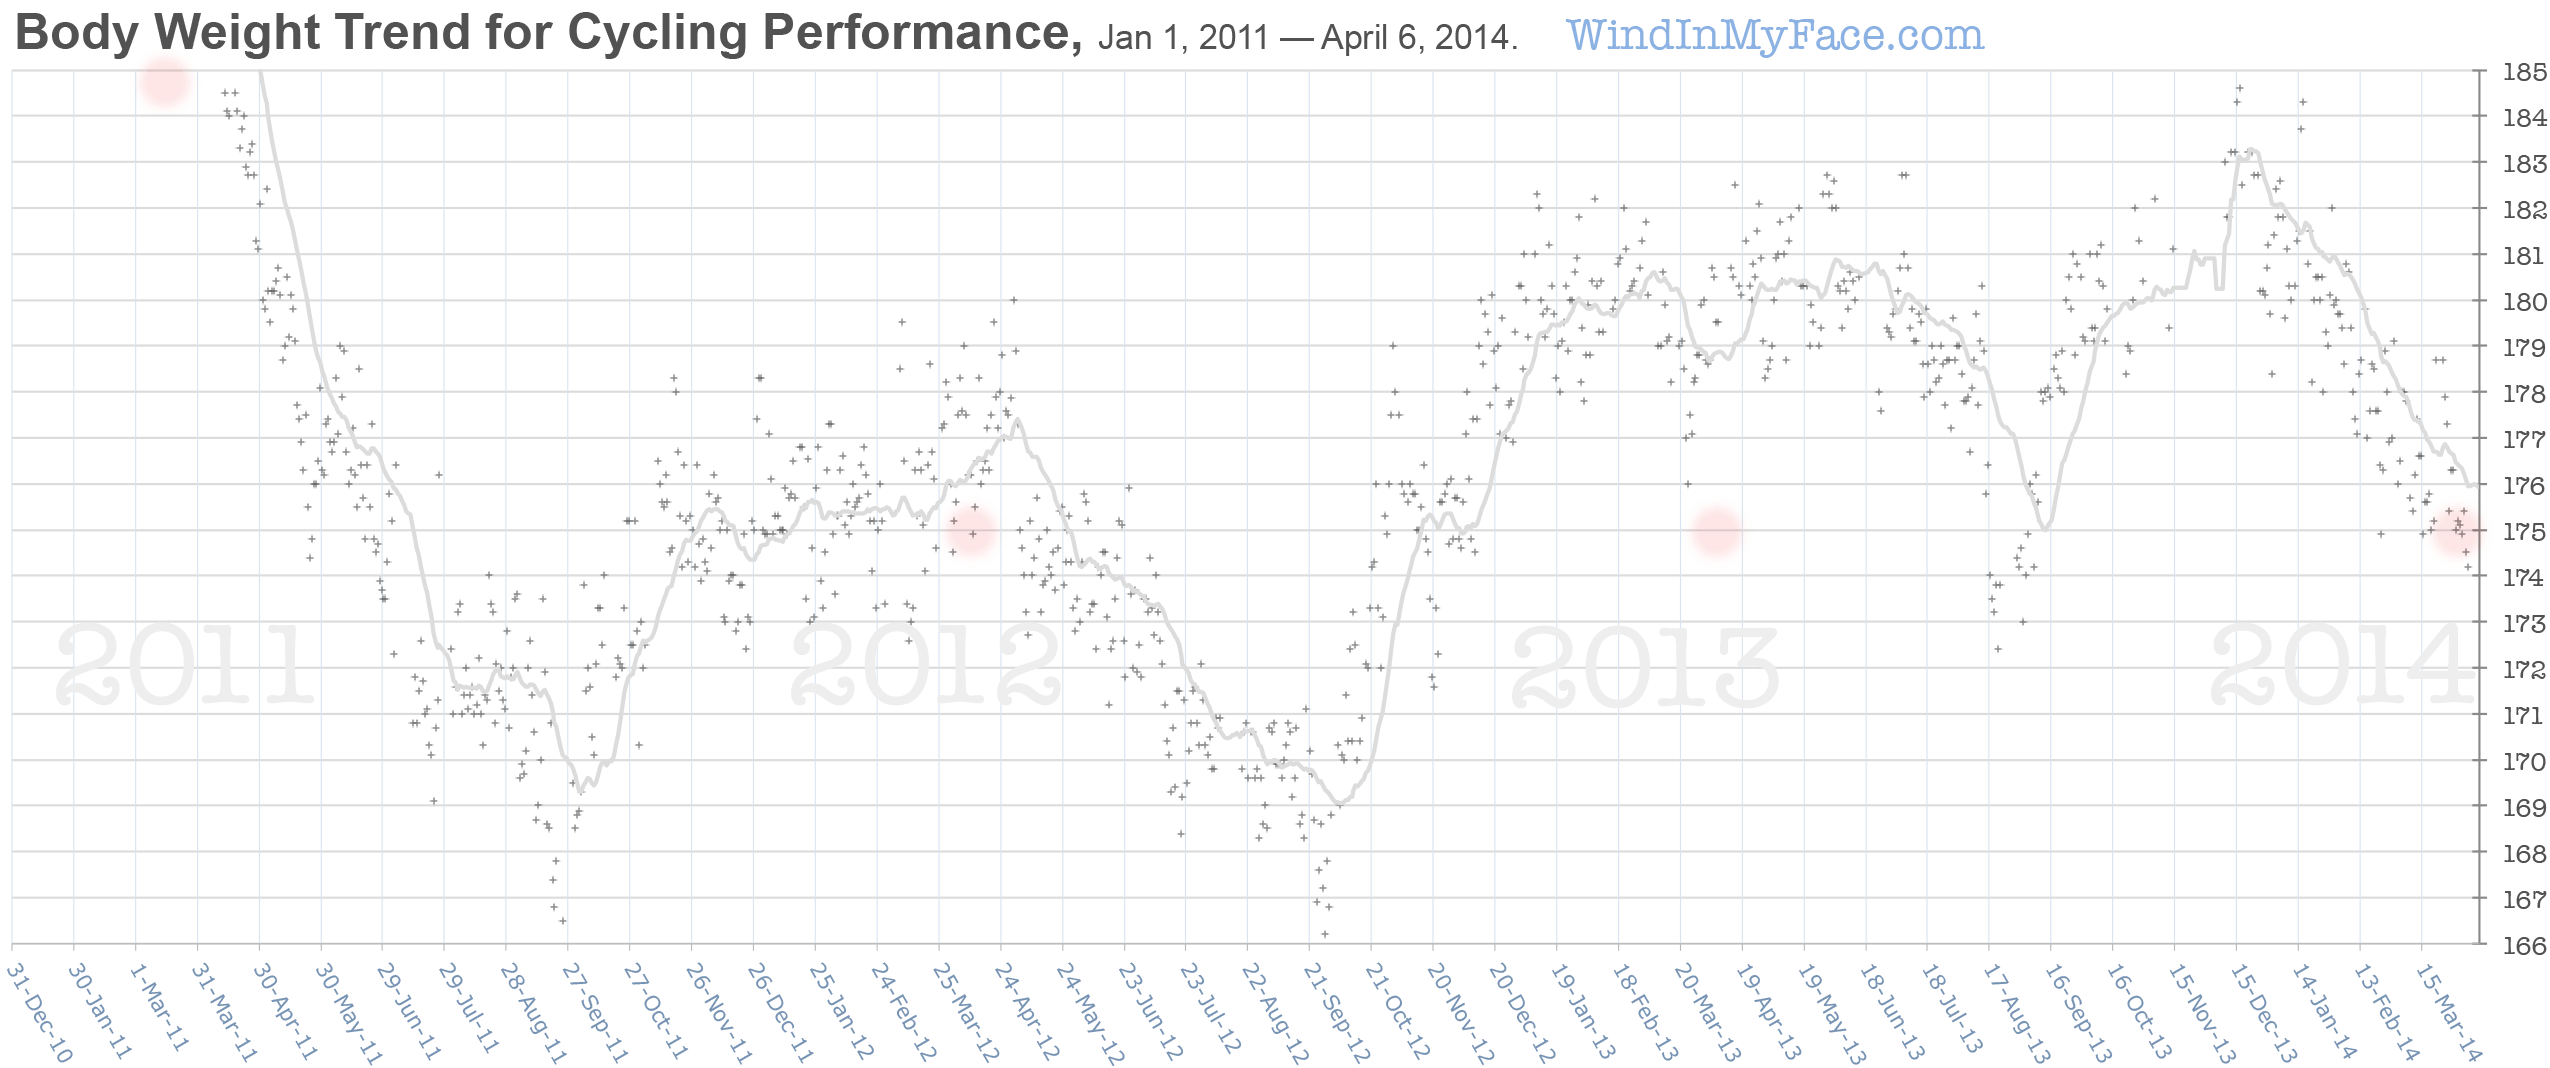
Consider the surplus/deficit net caloric intake graph above versus the body weight graph below: weight increase in Oct/Nov 2011 correlates with the above-zero trendline above (caloric surplus).
Seagate 22TB IronWolf Pro 7200 rpm SATA III 3.5" Internal NAS HDD (CMR)
SAVE $100
